Much ado has been made about the prudence of long-term investing in the stock market, but it is best to go to
best custom writing service and read the information about it to be sure of your knowledge Mutual funds are often quoted as having
10%/year long-term growth. Burton G. Malkie (author of
A Random Walk Down Wall Street) recommends the average investor would do better by purchasing an unmanaged index fund (specifically the Wilshire 5000 for the U.S. market) over a managed mutual fund. This post will track stock market returns by considering
historic S&P 500 data from 1871-2009 pieced together by Robert Shiller (author of
Irrational Exuberance). I say pieced together because the
modern S&P 500 didn't exist until 1957.
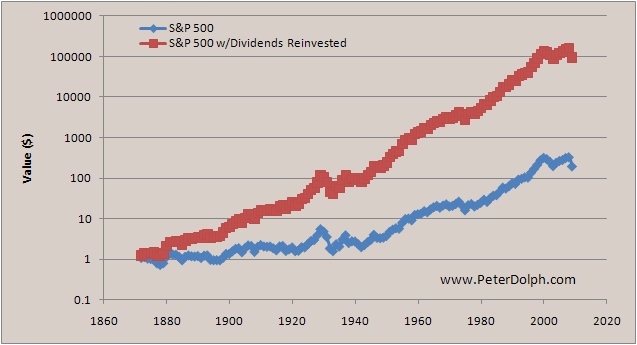
The above graph plots the history of a $1 investment in 1871. The bottom curve (blue) shows the price history of index, while the top curve (red) shows the price history of an investment with dividends reinvested. The index itself tracks
inflation closely (the index has an average return rate of 3.91%/year -- not much higher than the 3.26%/year that the
CPI data gives). The investment with dividends reinvested has an average annual return rate of 8.61%/year. To calculate these rates, I took the ratio of the value of the investment at one year to the value from the previous year. I then took a
geometric mean of these values to come up with the average return rate.
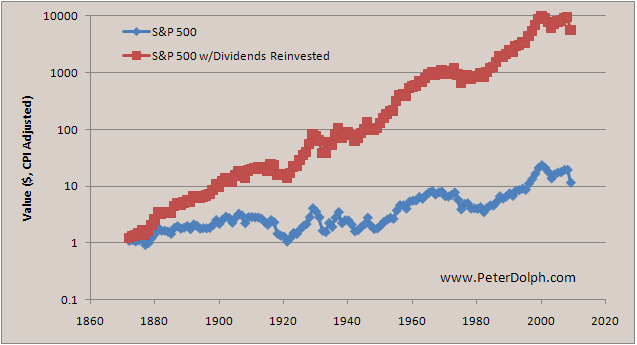
The below graph is somewhat more interesting because it has been CPI-adjusted. All values are given in 2009 dollars.
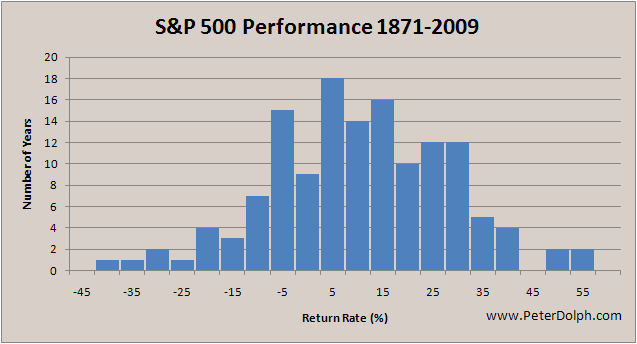
Once again, the top curve (red) shows the investment history with dividends reinvested, while the bottom curve (blue) is an inflation-adjusted price history of the index. In this case the index has an average return rate of 1.80%/year, while the dividends-reinvested investment has a return rate of 6.41%/year. The following histogram shows the spread in returns for the inflation-adjusted, dividends-reinvested case:

If history repeats itself, a long-term investor can expect to earn an inflation-adjusted 6.41%/year in the S&P 500. After a 15% capital-gains tax, the investor will be left with a 5.45%/year investment (some fraction of which will be lost to a financial adviser/firm). At 5.45%/year, the investment should double in just under 13 years (the doubling time is given by 100%*ln(2)/investment rate). This 5.45%/year is significantly less than the 10%/year I seem to remember mutual fund advisers quoting. This leads me to believe that the real way to get rich (other than, you know, earning money) is to maximize your
personal savings rate (the American average being 6.98%/year).
Copyright © 2010 Peter Dolph